Summary
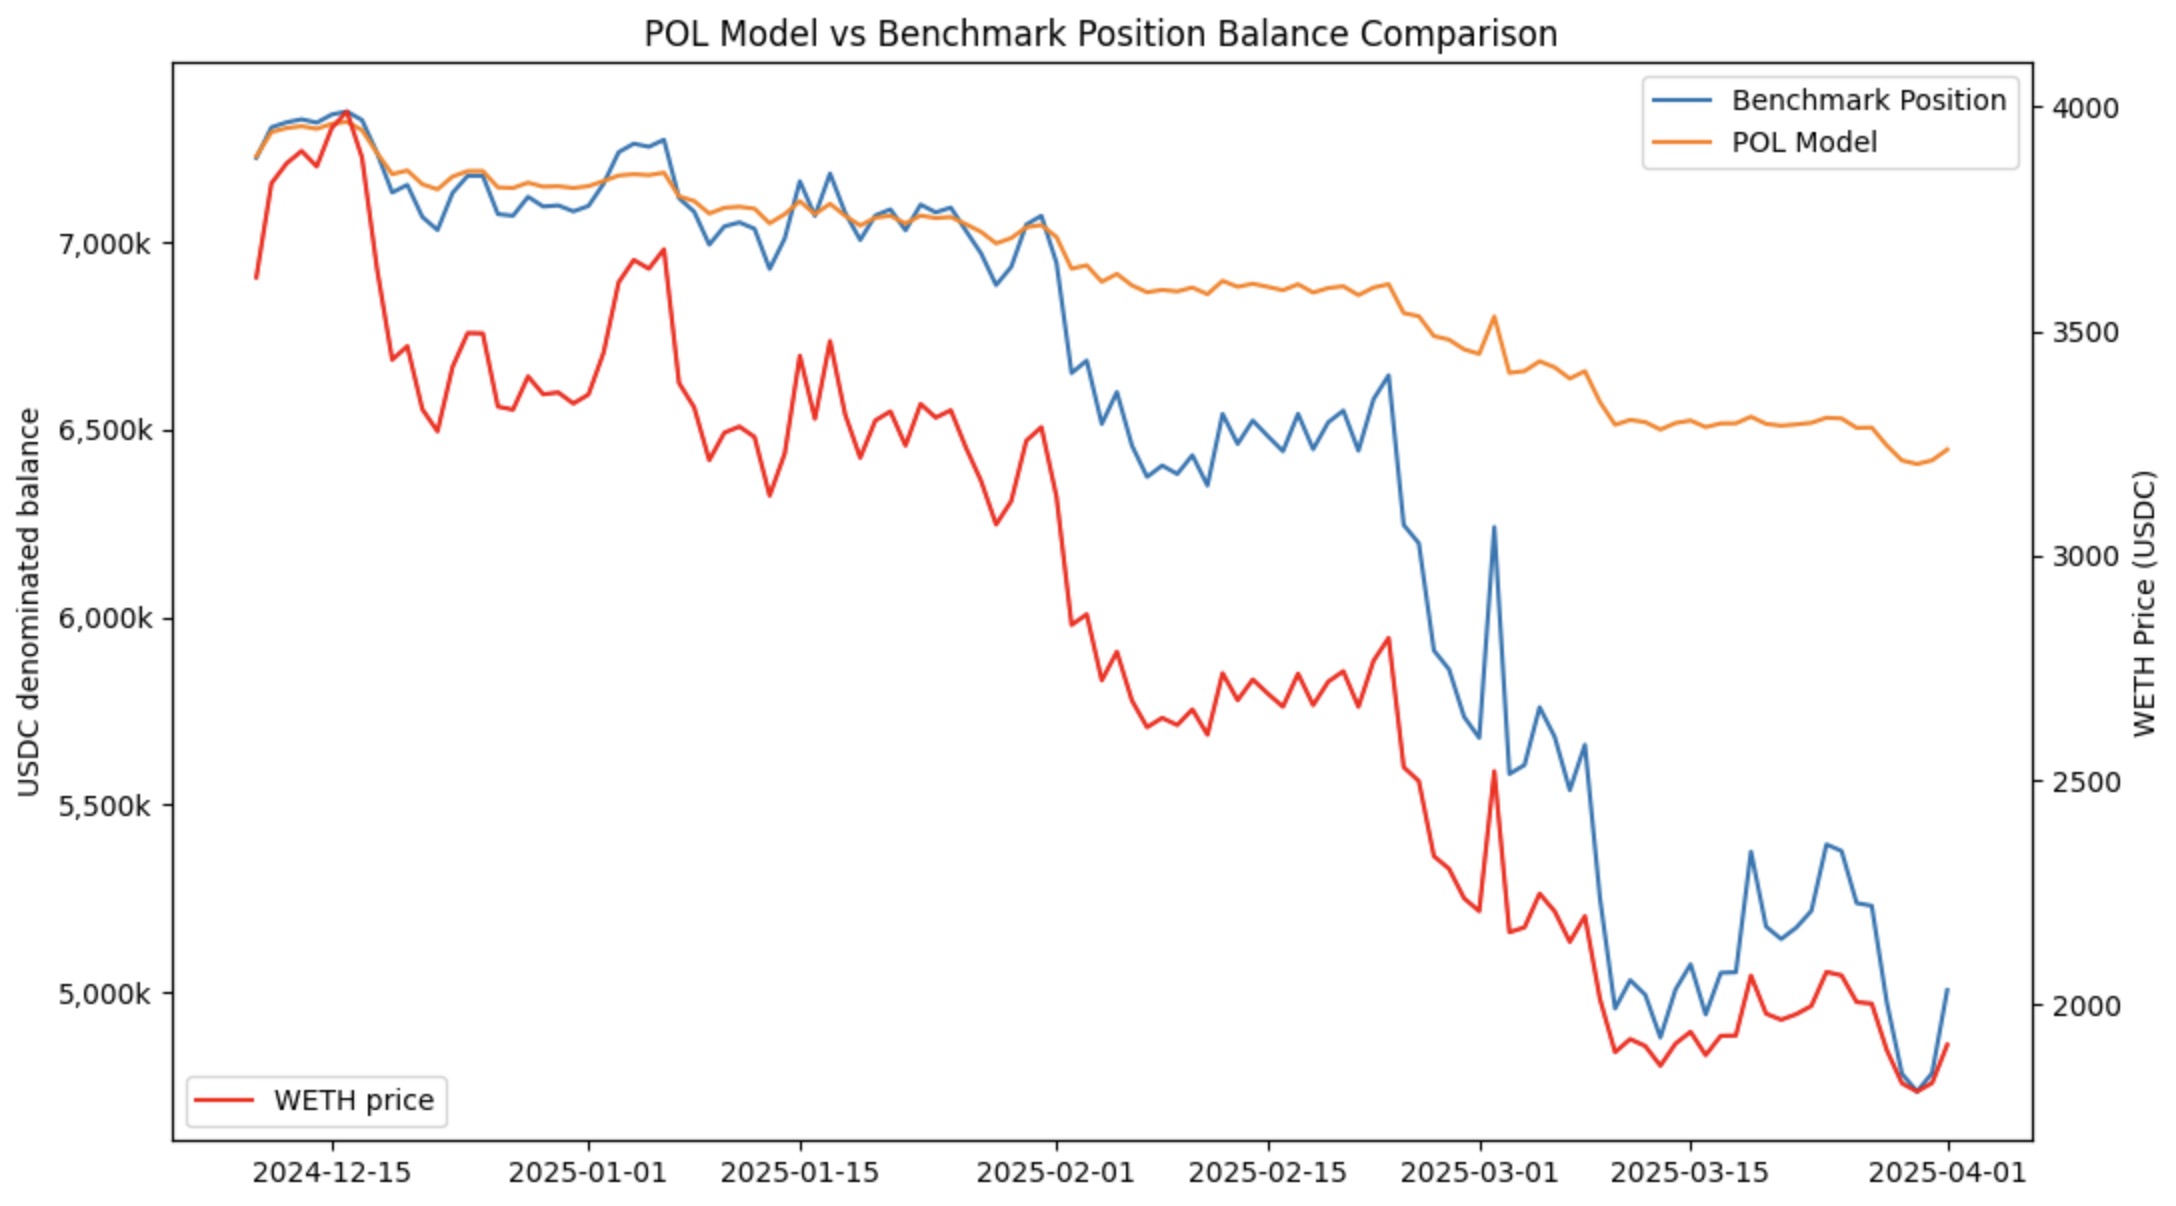
A backtest was conducted covering the period from December 10, 2024 to April 1, 2025, using the WETH/USDC 0.05% Uniswap v3 pool on Ethereum Mainnet. The benchmark strategy — a passive liquidity provision approach — incurred an estimated 28% capital loss over this timeframe. In contrast, our Protocol Owned Liquidity (POL) model experienced a notably lower drawdown of only 11%, despite being only minimally tuned. Liquidity provisioning fees were accounted for in the backtest of both the benchmark and the POL strategy.
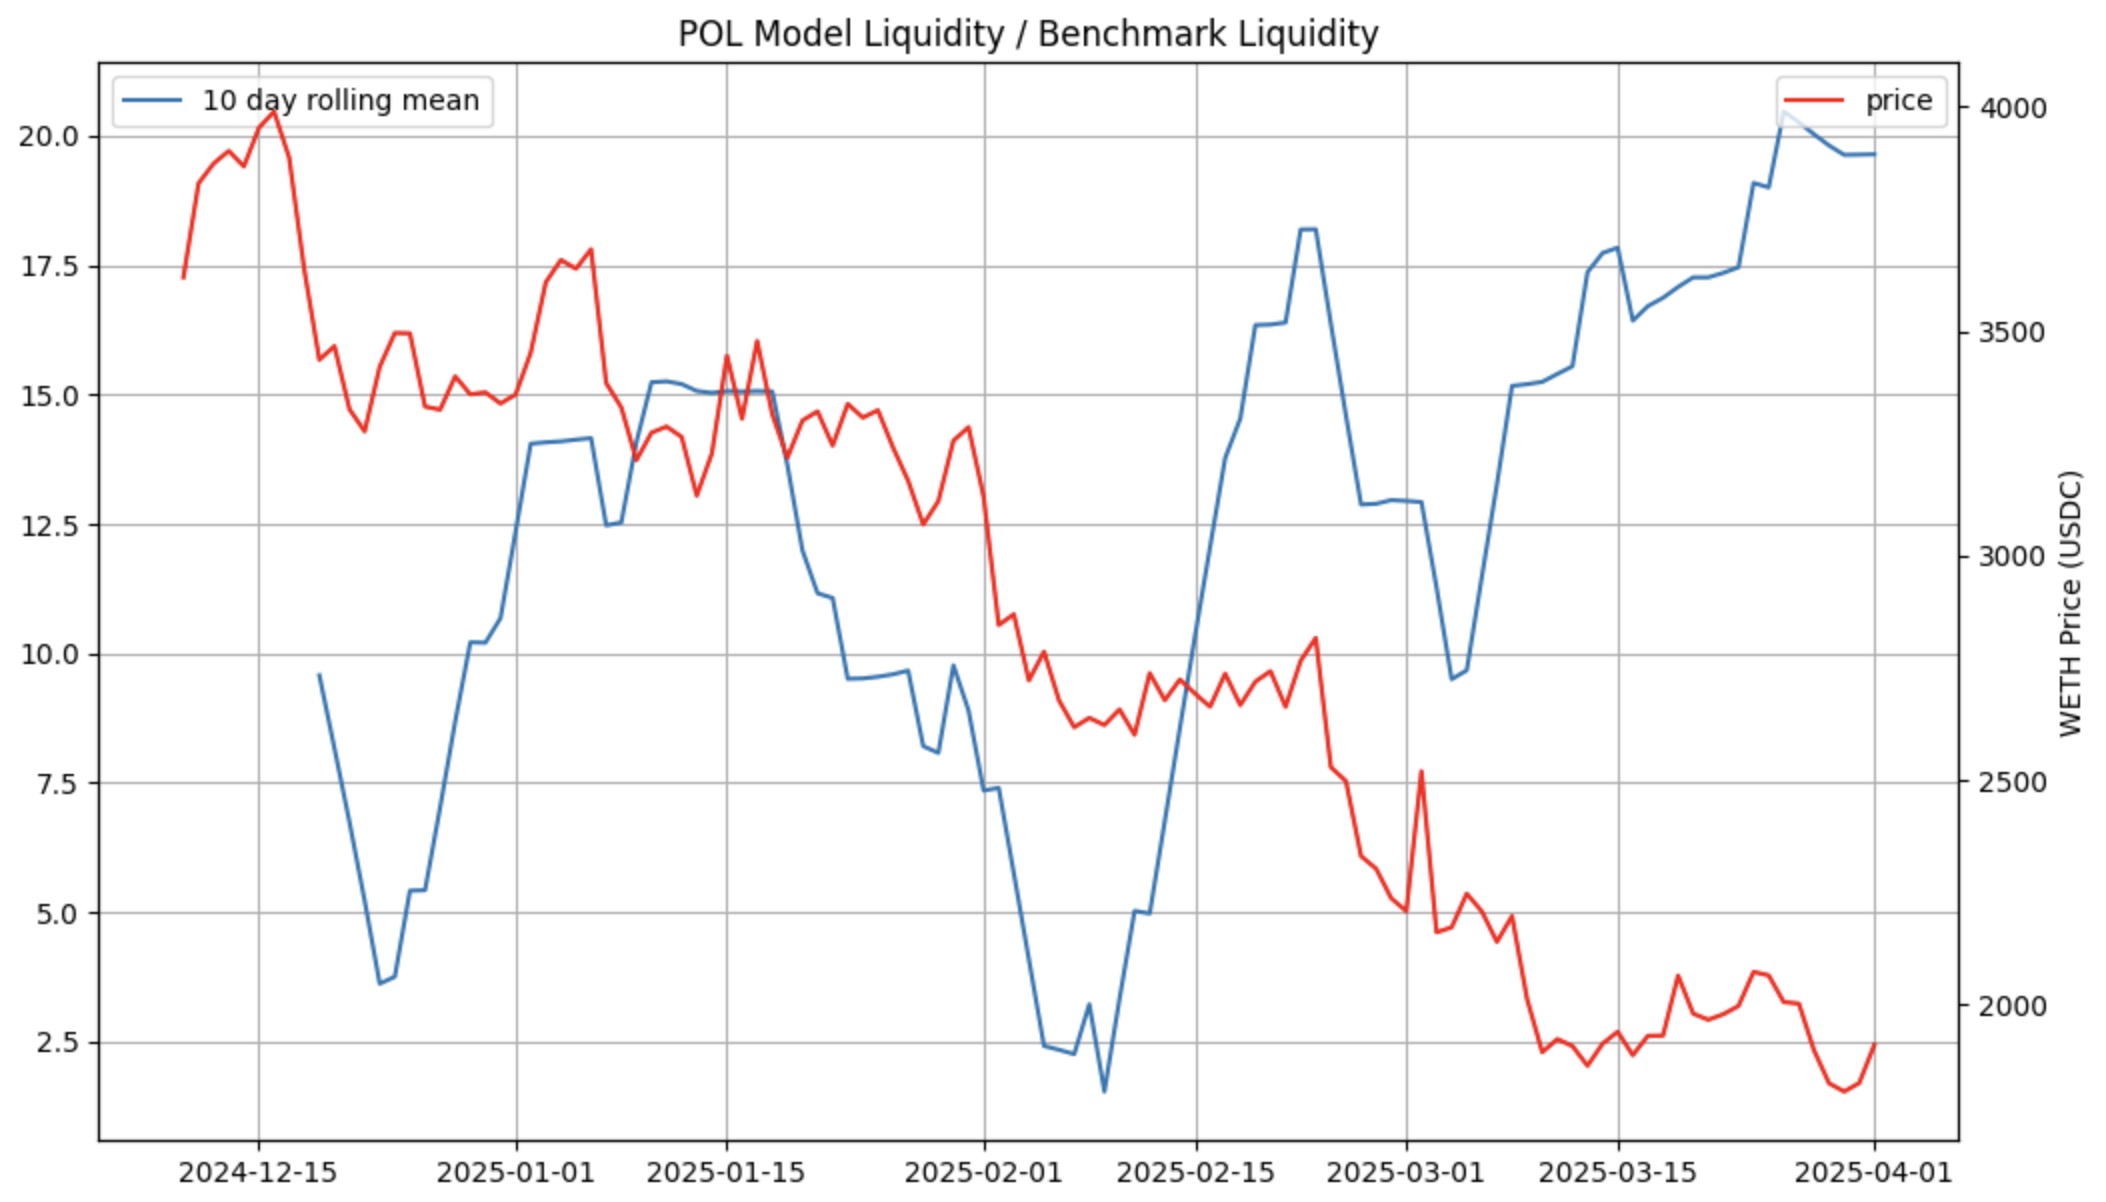
Furthermore, the POL strategy achieved consistently higher liquidity depth than the benchmark. This was measured by dividing the mean amount of liquidity (as defined by Uniswap v3) set by the strategy by the amount of liquidity in the benchmark position.
Benchmark strategy details
The benchmark position was structured as follows:
- Uniswap v3 WETH/USDC 0.05% position
- Static range: 1900 to 4300 USDC per WETH
- Liquidity requirements:
- 300,000 USDC placed 3% above the active price
- 300,000 USDC placed 3% below the active price
- Initial capital requirements:
- 5.8 million USDC
- 387 WETH
- Total USDC-equivalent value: ~7.2 million
POL model parameters
The POL strategy was initialized with the exact same capital allocation: 5.8M USDC + 387 WETH, totaling approximately 7.2M USDC at entry. Unlike the benchmark, however, the POL model dynamically adjusted its liquidity ranges and token composition over time to respond to market conditions.
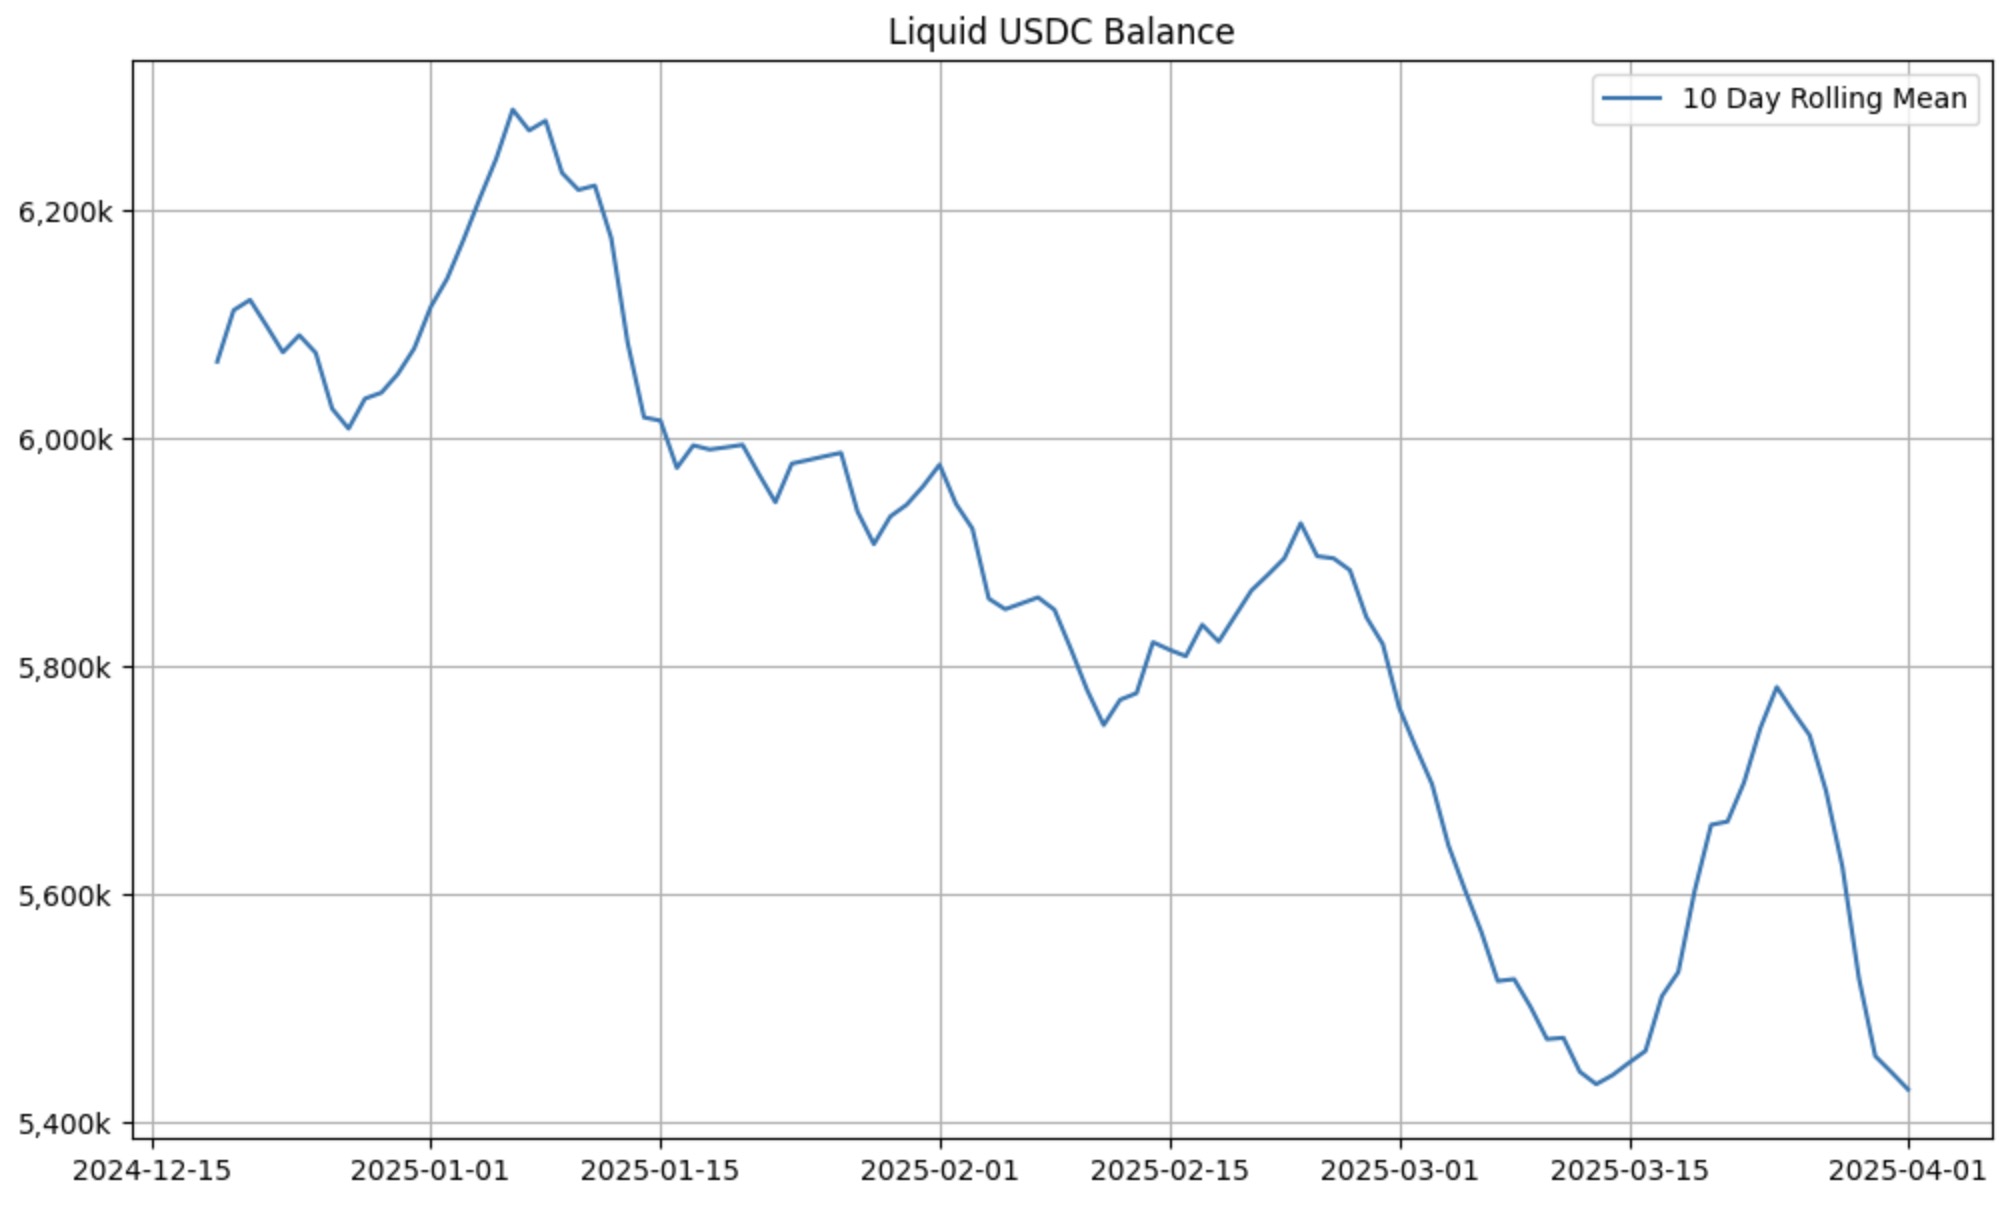
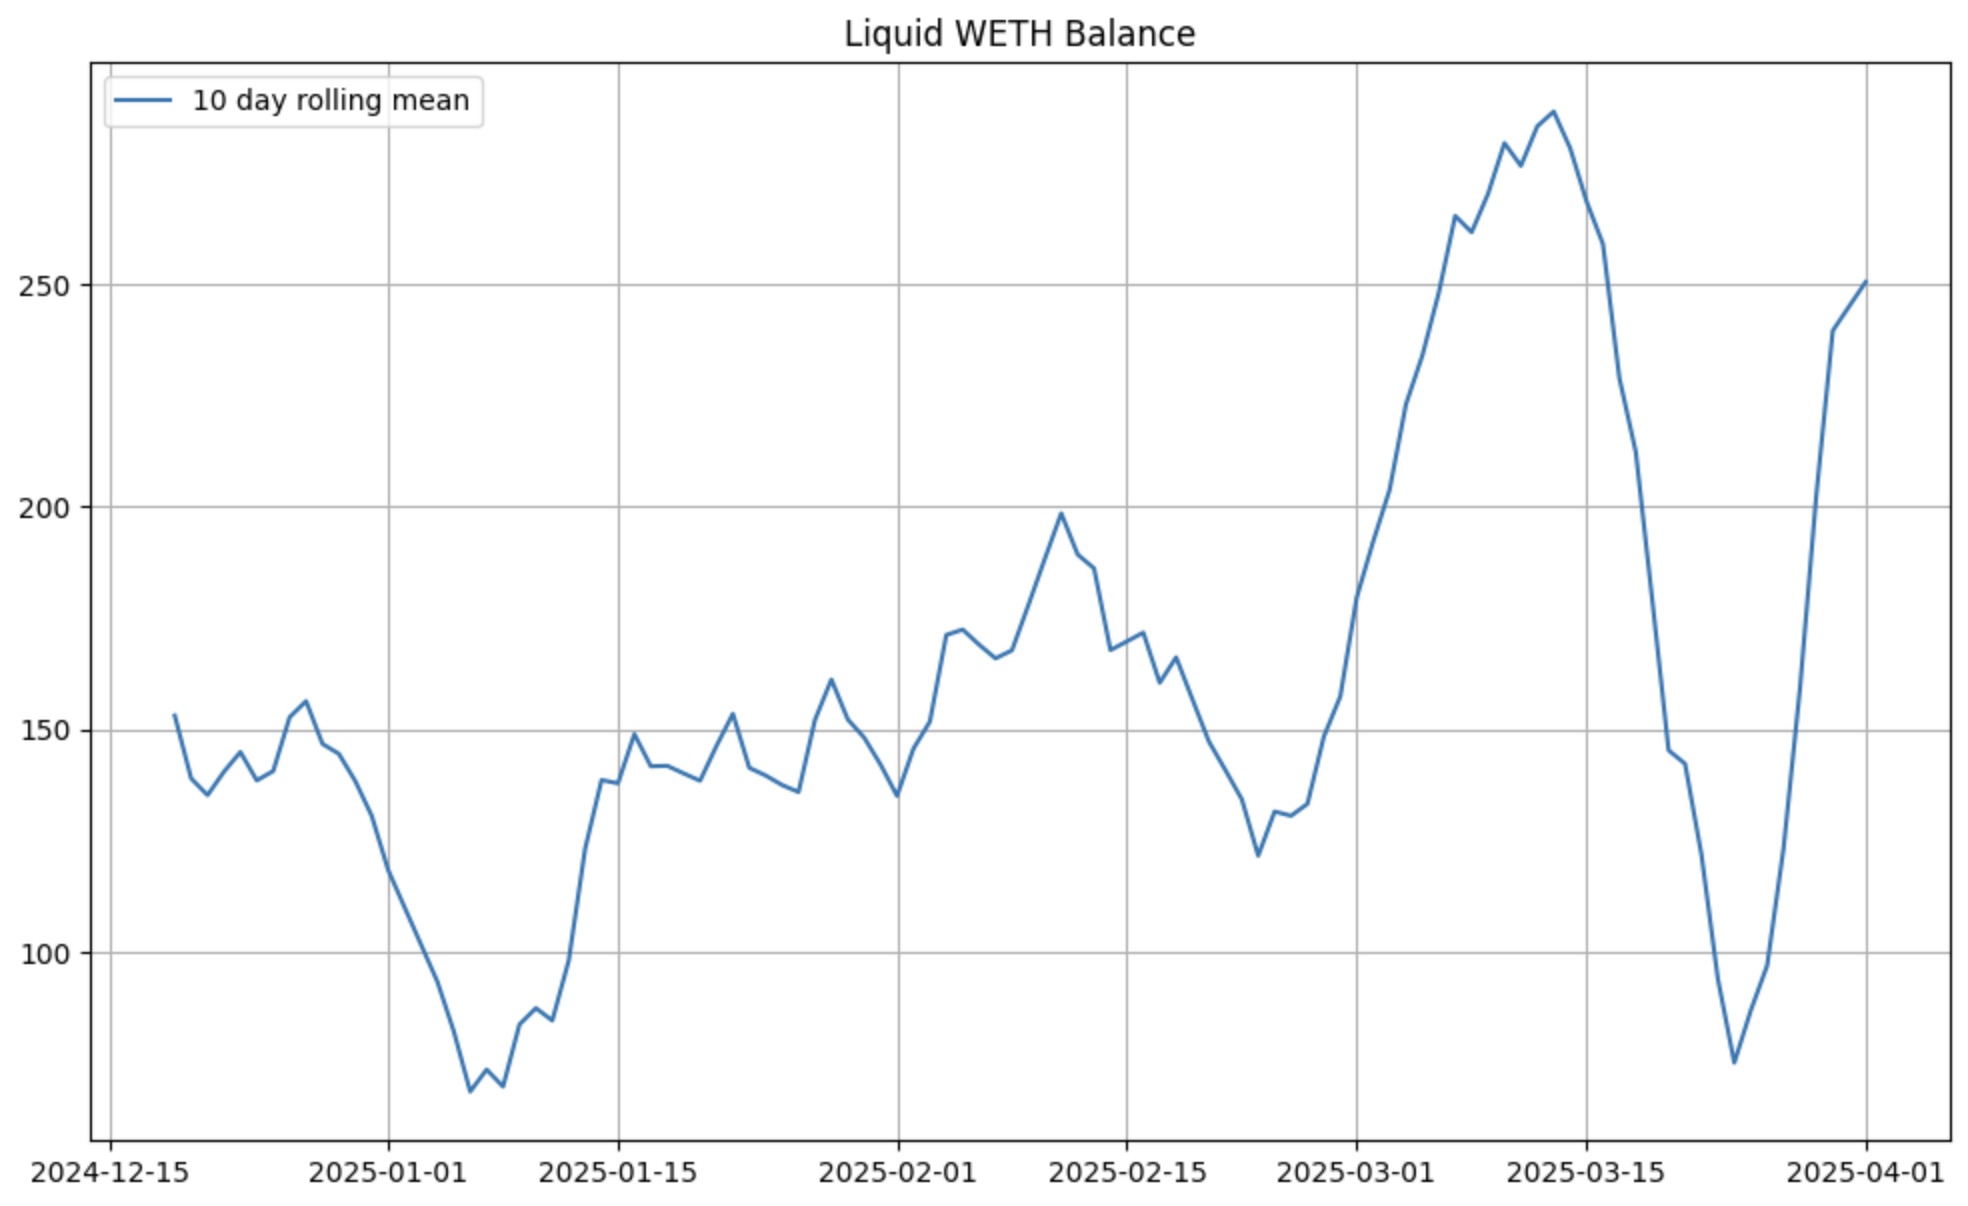
Although the market exhibited high demand for USDC relative to WETH throughout the testing period, the POL model maintained approximately 80% of the portfolio's capital worth in USDC as liquid and idle, meaning it was fully available for deployment in external money markets. Additionally, the strategy preserved a non-trivial amount of idle WETH, further increasing capital flexibility. These liquidity reserves could have been lent for yield or strategically redeployed, providing an additional buffer that would have further mitigated the already-lower 11% drawdown — something the passive benchmark strategy could not accommodate.
The only notable downside of the POL strategy is its expected gas cost of approximately 0.75 ETH over the testing period. However, this cost is negligible relative to the capital preserved from impermanent loss and the operational flexibility that the strategy enables.
Optimization outlook
While the strategy used for this backtest included necessary pair-specific calibration — as is required by all our models — the level of optimization was intentionally moderate. This test was designed to showcase the structural potential of the POL model, not the ceiling of performance.
In a full-scale deployment, our team would conduct a deep optimization phase tailored to the client's specific assets, risk preferences, and operational constraints. This includes simulation-based calibration of rebalancing frequency, range width, and capital efficiency parameters, along with dynamic inventory management logic to reflect treasury goals and market structure. Our approach is inherently adaptive and modular, allowing us to fine-tune the model to meet a protocol's strategic and behavioral profile.
This research was conducted by DAMM Capital, all rights reserved. If you are interested in this, feel free to reach out: Bauti.eth or Juan Samitier on Telegram, or DAMM_Capital on X.